
September 11, 2026
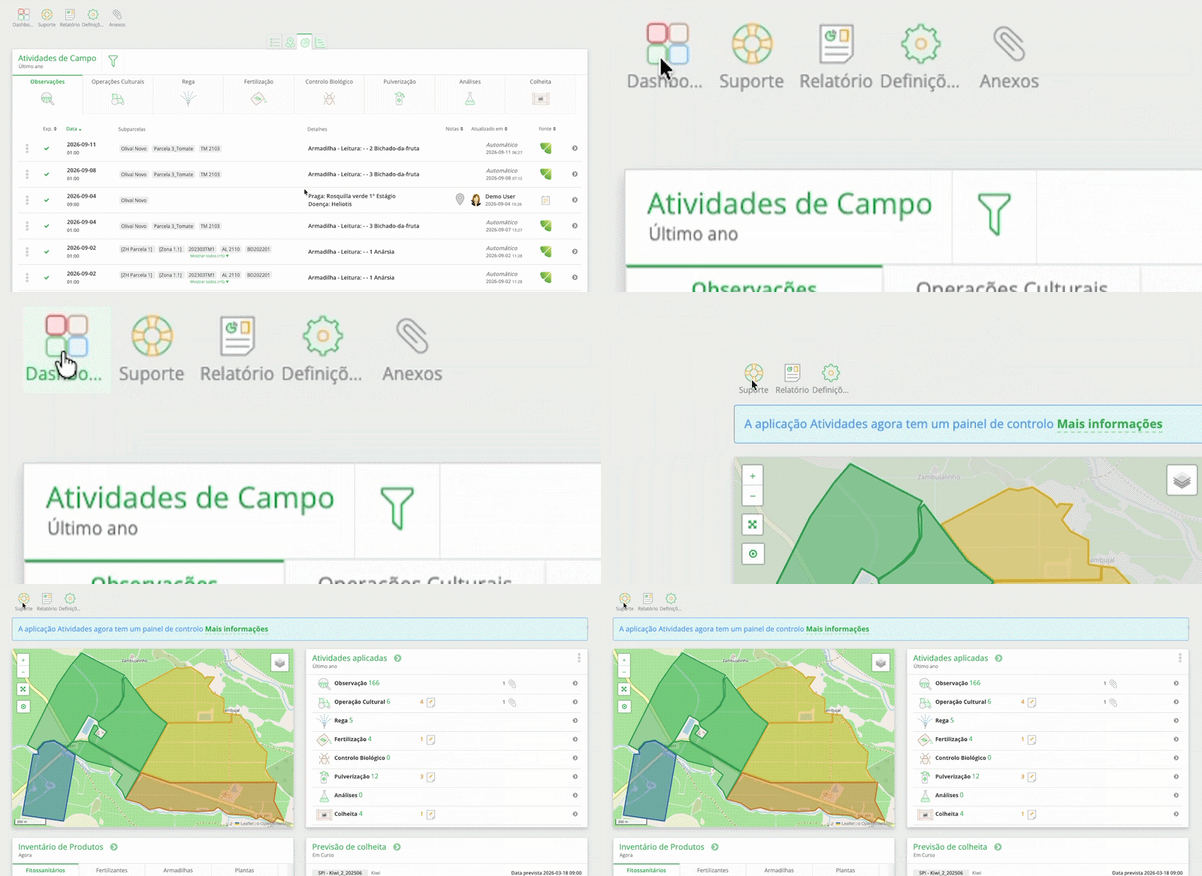
Field Activities app dashboard
The Field Activities app has a new dashboard that brings together, on a single page, the essentials about the state of your farm.
The change happens in two stages:
- Until 30 September 2026 — the app still opens on the activity list by category, as always. The dashboard is available from the Dashboard button, the first one on the bar in the top left corner, with the four coloured squares icon.
- From 1 October 2026 — the dashboard becomes the app's landing page.
The view that opens by default until 1 October doesn't go away: it moves inside the Applied Activities card. No functionality has been removed.
The six dashboard cards
1 · Map
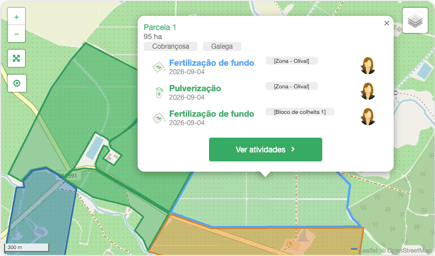
Shows your farm's fields and their boundaries. Use the zoom controls to zoom in or out, the layers button to switch between map types, and the location button to centre the map on your current position.
Click on any field to view the latest recommendations and activities carried out there.
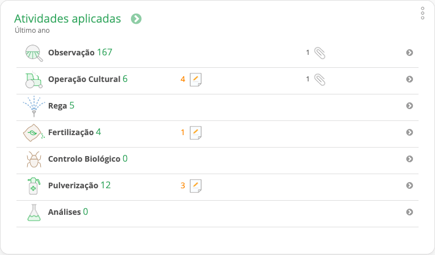
2 · Applied Activities
Number of recorded activities by category: Observation, Field Operation, Irrigation, Fertilisation, Biological Control, Spraying, Analysis and Harvest.
Next to each category, you can see the number of recommendations pending application and the number of attachments. Click the arrow on the right of each row to open that category's list.
This card is also the entry point to the list views you were using before.
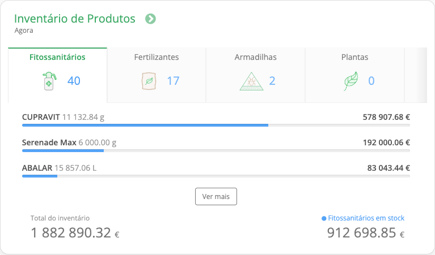
3 · Product Inventory
Current inventory status, divided by category. Each tab shows the number of products and, below, details of the associated quantities and value.
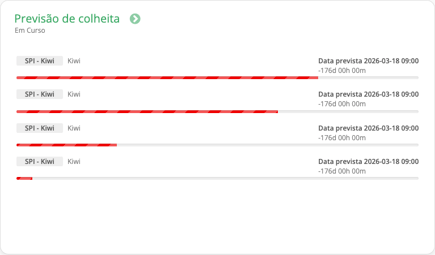
4 · Harvest Forecast
Get a quick overview of harvest progress for each subfield. The progress bar indicates how close the subfield is to its expected harvest completion date.
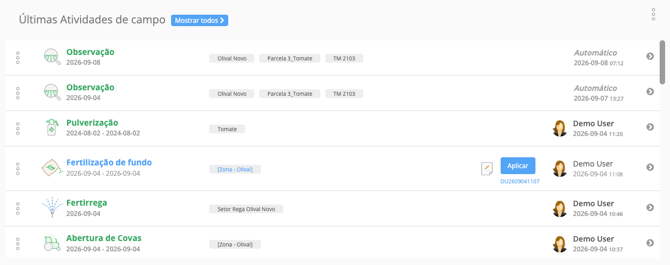
5 · Latest Field Activities
The most recent records, in chronological order, regardless of category. Useful for quickly checking what has been recorded over the past few days and by whom.
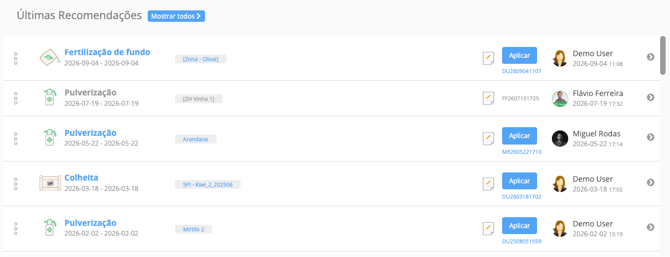
6 · Latest Recommendations
The most recent recommendations associated with your farm.
Where are the previous views?
Go to the Applied Activities card. There you will find the four familiar buttons at the top:
- All activities list - all records in a single list.
- Map - georeferenced activities displayed on the farm map.
- Activities by category - the view that opened by default until now, with the Observation, Field Operations, Irrigation, Fertilisation, Biological Control, Spraying, Analysis and Harvest tabs.
- Planning - activity planning.
July 9, 2026
John Deere integration
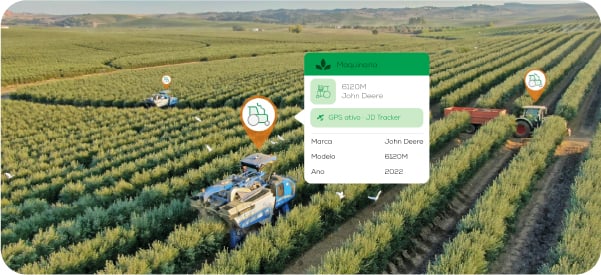
New integration with John Deere, allowing you to import data directly from the JD platform into Wisecrop, simplifying your farm setup.
What's changed
- Import machinery and implements with one click: name, make, model and year are imported automatically;
- Keep product references synchronised: just as you already do with your ERP, now also with John Deere;
- Track your tractors in real time: JD's GPS now automatically feeds data into Wisecrop, with no need to install an additional tracker.
March 10, 2026
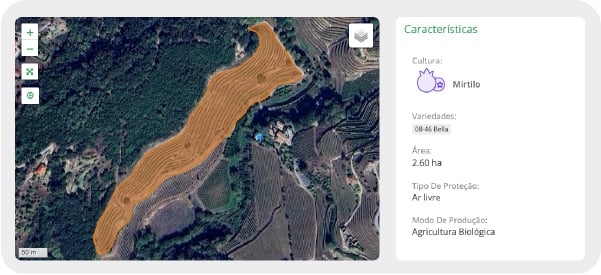
Draw subfields on the map
You can now create and edit subfield boundaries directly on the map, just as you already can with fields and irrigation sectors. IFAP importers will continue to automatically import land-use boundaries.
What's changed
- Draw subfields freely on the map using the same intuitive tool already available for fields and irrigation sectors
- In Kiosk, the subfield screen now includes a button to switch to map mode
- Subfields can now be selected directly from the map in Kiosk
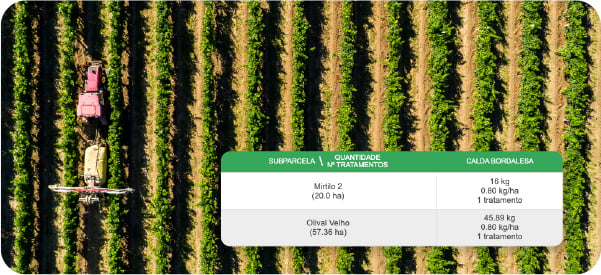
Active substances applied by subfield
As was already possible for nutrients, you can now view the active substances applied by subfield.
What's changed
- The Field Record now shows the quantities applied per active substance, rather than only the number of treatments
- Calculations now take the crop density field into account
February 4, 2026
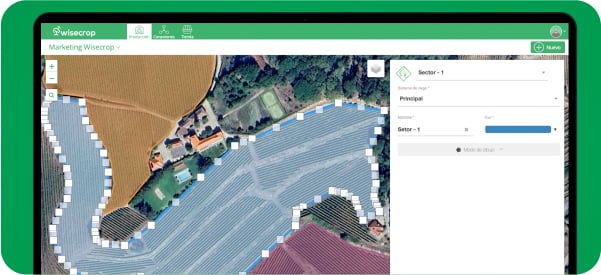
Georeferencing Irrigation Sectors
You can now create irrigation sectors by drawing them directly on the map, quickly and easily. This helps keep irrigation areas clearly defined and makes planning easier, particularly when field conditions change.
What's changed
- Draw on the map using an intuitive tool to define the sector boundaries
- Easily edit the boundaries whenever necessary
- Better organisation of irrigation areas for clearer planning.
How to access it
- From the side menu, click Settings and select Irrigation.
- On this new page, under the Sectors tab, you will see the list of existing sectors.
How to draw a sector
- If you already have sectors and want to draw them on the map, click the Details button. To create a new sector by drawing it on the map, click Add New.
- In both cases, a window will open where you can configure the sector. Complete the information as required.
- At the top of the same window, you will find the Georeferencing section. Click this section to view the sector drawing on the map. If no drawing exists yet, click Drawing Mode to create one.
Once created, you can edit and adjust the sector whenever changes occur (e.g. changes to lines, expansion or removal of an area, or irrigation adjustments). Keeping boundaries up to date helps ensure a clearer view of irrigation areas.
January 3, 2026
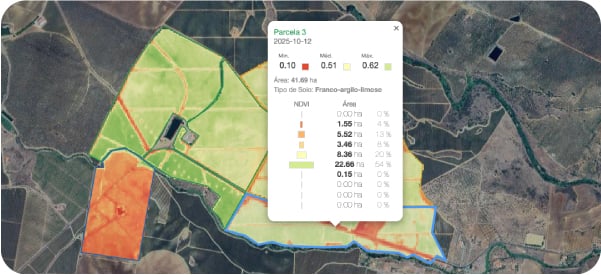
More accurate and easier-to-analyse NDVI
With a resolution of 2.5 m, Wisecrop NDVI now provides a more precise view of variations in crop vigour across your farm.
New charts have also been added:
- Detailed analysis by field
- Temporal evolution and comparison between fields
Customise work order reports
You can now select which sections you want to include: Activity, Operation, Weather, Products, Details, Labour, Equipment and Notes, making the document better suited to your needs.
Expanded connectivity
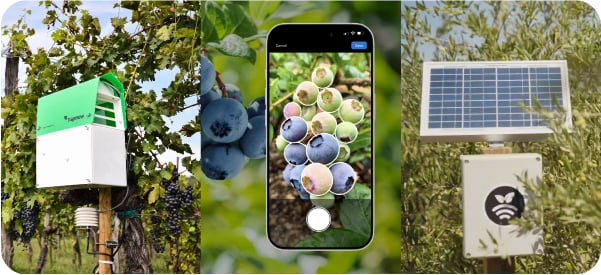
Here are our latest integrations:
- Trapview: smart pest monitoring
- Aerobotics TreeFruit: fruit size and yield forecasting and analysis
- Plantae: soil, irrigation and weather sensors
October 22, 2025
Changes to the Side Menu
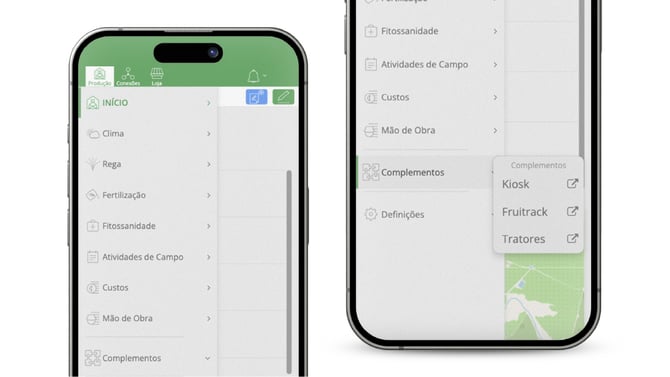
Starting October 29, the side menu will have a new structure designed to improve the navigation experience and make it easier to access different features and settings.
What's changed?
The main change is the introduction of a new section called "Add-ons", which groups access to the Kiosk, Fruitrack and Tractors tools.
The "Settings" section remains in the menu, but now has a clearer structure that includes Prod. Units (Production Units), Weather, Irrigation, Activities, Costs, Labour, Users, Integrations and Catalogues.
Note
This update allows you to manage user permissions in greater detail. We recommend checking your team's permissions under Settings › Users to make sure everyone retains the appropriate access.
Benefits of the new structure
- More intuitive navigation - Related features are logically grouped together
- Faster access - Fewer clicks to get where you need to go
- Cleaner menu - Improved visual structure with less information overload
Need help?
If you're having trouble finding a specific feature in the new menu, don't hesitate to contact our support team. Just click here. We're fully available to help!
October 9, 2025
GPS device for machinery
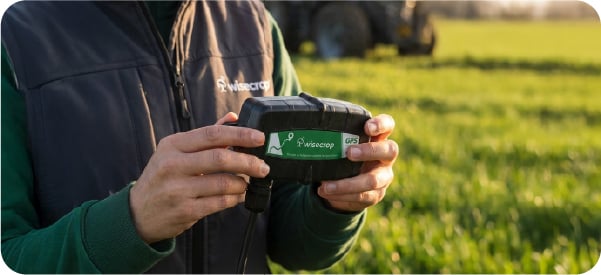
Introducing the new GPS Tracker device designed for real-time machinery monitoring. With this solution, you can track the location, movements and usage of your equipment, increasing security, optimising routes and improving your farm's operational efficiency.
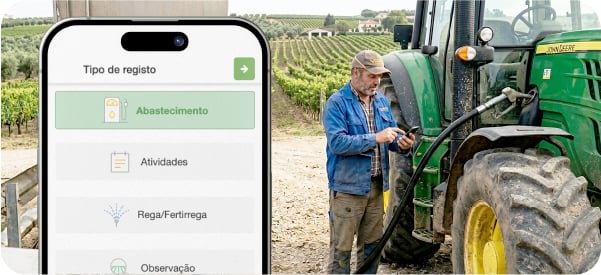
New machinery refuelling workflow
Kiosk now includes an optimised workflow for managing agricultural machinery refuelling. It allows you to record fuel consumption quickly and efficiently, giving you greater control over operating costs.